What’s causing it!
Severe storms and flooding as a consequence of climate change
BY FATIHAH MANAF
In Malaysia, flooding has always been predicted to occur in the East Coast area during the monsoon season. It is between November to February where islands in this part of the country are closed to tourists.
However, Malaysia had witnessed a severe flooding event in Pahang last year. Question: Did climate change cause this?

Leading to their Global Climate Conference event, Rotary International Malaysia held another webinar session entitled “Severe Storms and Flooding as a Consequence of Climate Change”.
In this discussion, Gabriele Villarini, a professor in the Department of Civil and Environmental Engineering at the University of Iowa, talked about his methodology and approach in relating flooding events to climate change. His discussion was centred around the flooding events across the central US.
This webinar series was jointly organised by Rotarians, members of District Action Group on Environmental Sustainability (DAGES) Malaysia, Rotaractors and Interactors. The session was moderated by Ir Dr Kriban G Naidu, the President of the Rotary Club of Damansara.
Methodology and approach
Villarini said he had personal experience with severe flooding near his area in 2008. This led him to be interested in knowing how the country suffered a flooding event of this magnitude, what caused it, and what the event said about the future.
He highlighted the things he would be looking at regarding these events based on observational data.
He said: “My approach is to look at the historical data and how it can be translated in a way it can say something about the future.”
Villarini said he often took a simplistic approach in his research. It allowed him to understand and highlight the critical aspects of the study. The professor said he used the concept of the hierarchy of ‘whys’ in which he would ask “why?” to anything until he found the answer to his questions.
“So, the first question I ask myself, or we ask is ‘can we detect changes in flooding?’, and in this context, I’m referring to changes in the frequency of flood events.
“My goal is to identify flood events, and for this, I will need to set a threshold and figure out what these events are,” said Villarini.
He stated that peak over threshold (POT) would be the first criteria he would be looking at while analysing the changes in the flooding.
Seasonal flooding events
The professor then picked two peaks per year and looked at the seasonal time series of flood counts. He showed four panels that included the four seasons: winter, spring, summer, and fall.
“By doing this, there are some insights that we can already gain by simply looking at these four panels on the right. It tells us something about the seasonality of flooding. Clearly, they don’t occur in winter and fall. Most activities happen in spring and summer.
“You can see that you have up to nine flooding events in a given season. This gives us some indications, some qualitative visual indications of how things have been changing,” said Villarini.
He pointed out how the tendency for flood events to occur had increased significantly over the years since the 1990s.
He then showed some panels where there were maps with colour-coded stations. He concluded that there were large areas in the central of the United States where the frequency of flood events increased significantly. They had risen across seasons and thresholds.
“Data indeed shows there is an increase in the frequency.”
Importance of historical data
The professor stated he had worked with some engineers and developed guidance and tools to detect these changes in flooding. He highlighted it essential to see these changes. They would help people, especially engineers, learn things from the past and design the future.
“If the past no longer reflects the future conditions, how do we move forward?” he said.
He said the historical data was indeed crucial for this event. It was also essential to know what to do once changes had been detected.
“Should we assume things will keep progressing at the same rate? Could it be that they will be plateauing? Could it be, for some reason, will be going down?
“If we can understand the past, where we are and where we are going to, we’re much better positioned to say something about what the future would look like,” said the professor.
Why the changes in flooding happen?
“Could it be climate-related drivers?” asked the professor as part of his answer to his second question on the hierarchy of ‘whys’.
To answer the question, Villarini said his team had analysed many sites across the central US. He said that they were fortunate as they have longer complete records of the places in the US.
He did not want to think that everything occurred due to climate change. So, it was only fair to recognise the changes which might have been caused by the urbanisation and agricultural intensity.
He said that agriculture and its landscape management might be another critical driver that could help people understand and explain their observational data.
He also stated that urbanisation played a significant role from a hydrological perspective. This was observed in Minneapolis and Chicago.
He said: “We also want to take that (agriculture and urbanisation) into account.”
He had constructed time series of basin-averaged predictors to predict what might occur about the flooding by looking at four parameters which were agriculture (percentage of the basin), urbanisation (population), climate change (heat temperature) and seasons (total precipitations).
He then went back to the question and asked if these changes could be attributed to the climate? He answered, “Yes, as the precipitation and temperature do most of the work.”
Frequency of flooding increases as precipitation pattern changes
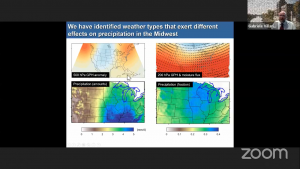
As for this issue of precipitation, Villarini said they would be looking at the ‘weather types’ perspective. He stated that they had identified weather types that had exerted different effects on precipitation in the Midwest.
This then answered another question on the hierarchy of ‘whys’ for the causes of flooding across the central US. He said: “Could the weather types be a mechanism which could help us explain this event? The answer is yes.”
This then led to another question on the hierarchy of ‘whys’ on why the weather types would cause the changes in flooding frequency to happen.
“Could we explain this in the context of greenhouse gases, or is it just much more coming from the natural variability of the climate change system?” asked the professor.
He said that much of the observed increasing trend can be attributed to greenhouse gases.
The professor also shared a graph that discussed anthropogenic forcing during the 2008 flood event in eastern Iowa. He then concluded that anthropogenic climate change plays a significant role in the flooding frequency. He highlighted that more considerable changes are expected to happen later in the 21st century during the springtime.
He said, moving forward, people need to think about the impacts of anthropogenic climate change, not only on the environment but also on the economy and society.


